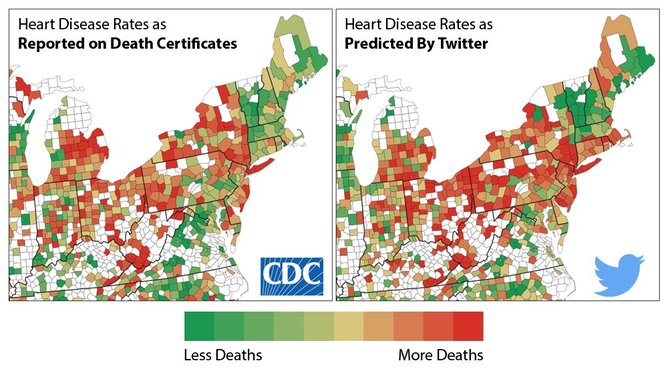
A spate of articles have reported a study that claims the ability to predict a communities’ risk of heart disease from the language most commonly used by that community on twitter.
Analysing 148 million tweets, the researchers from the University of Pennsylvania and the University of Melbourne mapped the tweeters to counties in the US for which they also had data about the incidence of heart disease and other health and demographic data. The researchers found that they got a higher correlation between the language used in tweets from people in those counties and heart disease than the correlation between heart disease and other indicators such as income and education, smoking, chronic disease and racial background.
The language that signalled the increased likelihood of heart disease was broken down into 3 different categories of hostility/aggression, hate/interpersonal tension and boredom/fatigue. Words that were frequently used within those categories included words such as “fuck”, “hate”, “drama”, “bitches” in the hostility/hate categories through to “tired” and “shower” in the boredom category.
People tweeting in areas that had a lower risk of heart disease on the other hand tended to use words such as “conference”, “student”, “holiday” and “faith”.
The mainstream press, encouraged by the researchers involved in the study, have picked up on this study as another example of how “big data” and social media can reveal a whole range of information about a population’s health and well-being. One report featured the graphic from the study that showed the actual incidence of heart disease in a part of the US with that predicted by Twitter.

The interesting thing about the graphic is that if you actually compare the specific areas in each of the two diagrams, they are not particularly the same at all.
The graphic is a great example of how data visualisation can be used to mislead the viewer. The two diagrams seem similar because they use the same colours and have identical areas which have to be the same because no data is available.
Pick any two identical blocks however and the chances are that they won’t be the same colour. This is because the predictive power of the twitter analysis is actually quite low. Granted, the analysis may be slightly better than using a combination of other indicators such as income, education, chronic disease and race, but that difference is in actual fact minuscule.
So what is the general language on Twitter actually saying? Well, it is likely that the language used in tweets may reflect the socio-economic level of a particular area. But even this claim is making a number of unsubstantiated assumptions. It is easy to suppose that lower socioeconomic populations would tweet more frequently about things they hate using swear words than people who are more likely to be educated from higher socioeconomic backgrounds. Interestingly however, the study claims to have “controlled” for socio-economic status, which means that the researchers believed that the language used was not simply a representation of this status. Unfortunately, no details are given of how they did this and so it is not possible to say whether this was actually a reasonable assumption.
The study is interesting in that it suggests that a specific communities’ makeup can be identified by the language that they use on social media. This in turn may be an indicator of other factors such as the specific community’s health and well-being and the consequences of that health and well-being.
However, as attractive as those suggestions may be, the study showed weak correlations and gave very little underlying support for any particular theory of “causation”. So as much as they could speculate, the researchers could really not say why they saw these statistical results. The paper actually highlights some of the fundamental problems with so-called big data where large numbers distort statistics to point at imagined relationships.
What this study definitely does not say is that being angry on twitter will lead to, or is anyway related to, heart disease, which has been the unfortunate suggestion in the selling of the study in news reports.
David Glance does not work for, consult to, own shares in or receive funding from any company or organisation that would benefit from this article, and has no relevant affiliations.
